Report of database usage in 2013
USING OF NATURE OBSERVATIONS DATABASE IN 2013
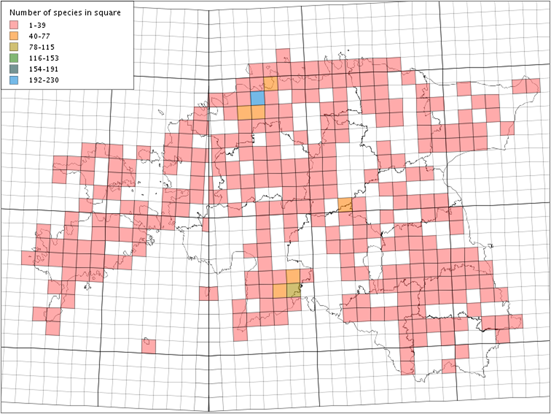
In 2013, users submitted 7210 observations to the Nature
Observations Database. It was the best year in the history of the database This map shows distribution of inserted observations
in 2013.
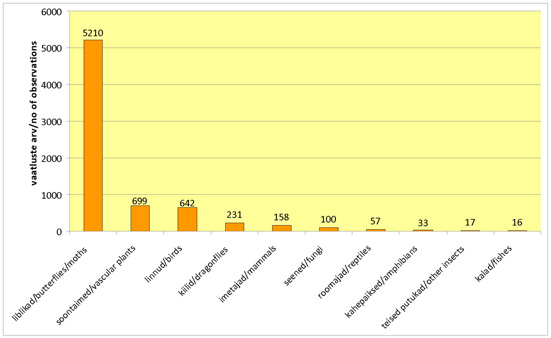
By groups of species inserted observations divided as
follow (here are only TOP 10 of species groups):
1) butterflies/moths - 5210 observations,
2) vascular plants - 699 observations,
3) birds - 642 observations,
4) dragonflies - 231 observations (dragonflies were separated amongst other insects in 2013 by user demand),
5) mammals - 158 observations,
6) fungi - 100 observations;
7) reptiles - 57 observations,
8) amphibians - 33 observations,
9) other insects (not include butterflies/moths and dragonflies) - 17 observations.
10) fishes - 16 observations.
The most popular species which observations were entered were:
Autographa mandarina 104 observations, Hyponephele lycaon 79 observations, Carterocephalus palaemon 78 observations, Apatura ilia 77 observations, Noctua interposita 75, Thymelicus sylvestris 74 observations, Hamearis lucina 72 observations and Catocala fulminea and Zygaena minos 63 observations. Summary observations of 1327 species were entered during the year.
Observations of species, which are under nature
conservation in Estonia, were entered 649: 11 of these were observations of species under protection category I, 107 under protection category II and 531 under protection category III.
118 persons entered their observations to the Nature
Observations Database in 2013. 76 of them inserted three or more
observations, 41 of them inserted more than 10 observations and 7 of them inserted more than 100 observations. There were two persons who inserted even more than 1000 observations.
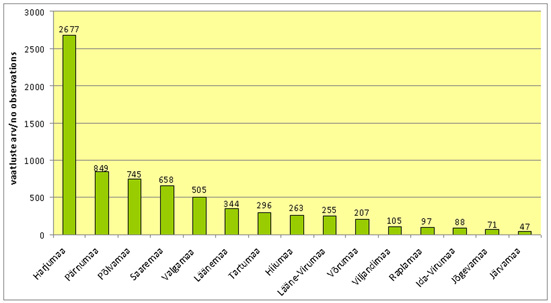
By county: users entered more than 100 observations to
the Nature Observations Database from 11 counties. First was Harju (2677). Followed Pärnu (849), Põlva (745), Saare (658), Valga (505) and Lääne (344).
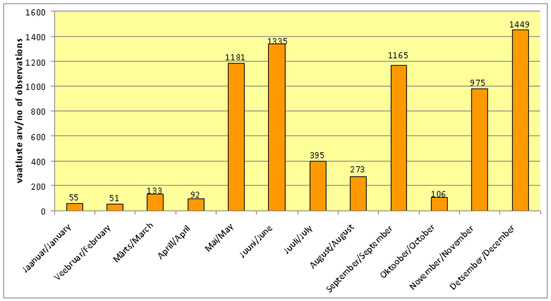
Observations submitted to the database were more frequent
in summer and at the end of the year. The biggest numbers of inputs were in December (1449). Next were June (1335), May (1181) and September (1165). Like you can see from the next graph, these four months were only monts were observations were entered more than 1000.