Report of database usage in 2016
USING OF NATURE OBSERVATIONS DATABASE IN 2016
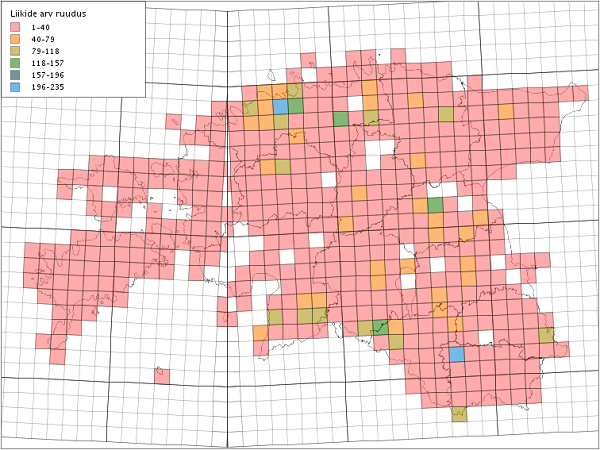
In 2016, users submitted 11,037 observations to the Nature
Observations Database. It was the best year in the history of the database. Number of observations increased because of smartphone application which came to the market in the end of 2015 and gives opportunity to insert observations on the observation place. Next map shows distribution of inserted observations in 2016.
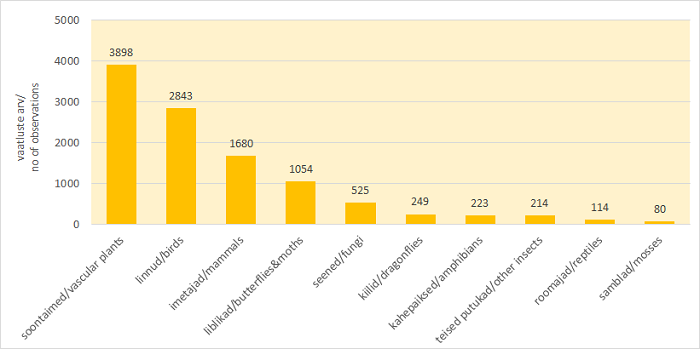
By groups of species inserted observations divided as
follow (here are only TOP 10 of species groups):
1) vascular plants - 3898 observations,
2) birds - 2843 observations,
3) mammals - 1680 observations,
4) butterflies/moths - 1054 observations,
5) fungi - 525 observations,
6) dragonflies - 249 observations;
7) amphibians - 223 observations,
8) other insects (not include butterflies/moths and dragonflies) - 214 observations,
9) reptiles - 114 observations,
10) mosses - 80 observations.
The most popular species which observations were entered were:
Eptesicus nilssonii 227 observations, Capreolus capreolus 224 observations, Ciconia ciconia 179 observations, Sciurus vulgaris 147 observations, Gonepteryx rhamni 131 observations, Knautia arvensis 111 observations, Vulpes vulpes 109 observations, Laserpitium prutenicum 108 and Erinaceus europaeus 103 observations and Alces alces 91 observations. Summary observations of 1548 species were entered during the year.
Observations of species, which are under nature
conservation in Estonia, were entered 2857: 184 of these were observations of species under protection category I, 734 under protection category II and 1939 under protection category III.
350 persons entered their observations to the Nature
Observations Database in 2016. 160 of them inserted three or more
observations, 87 of them inserted more than 10 observations and 24 of them inserted more than 100 observations. One person entered even more than 1000 observations.
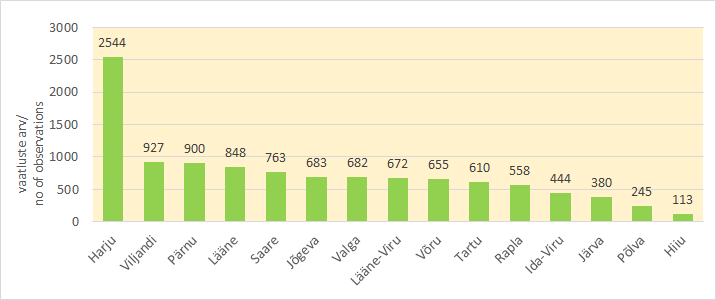
By county: users entered more than 100 observations to
the Nature Observations Database from all 15 counties. First was Harju (2544). Followed Viljandi (927), Pärnu (900), Lääne (848) and Saare (763).
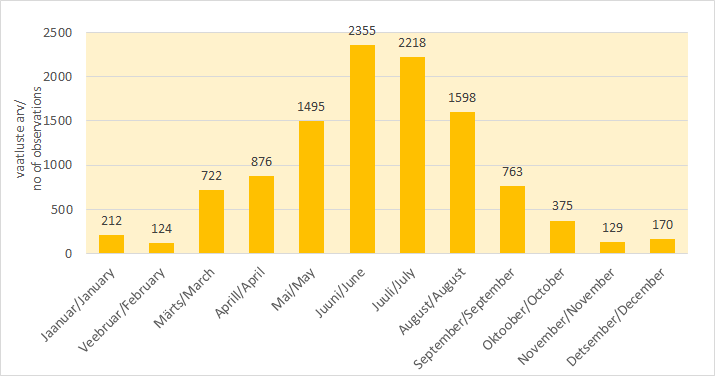
Observations submitted to the database were more frequent
in June and July. The biggest numbers of inputs were in June (2355). Next were in July (2218).