Report of database usage in 2014
USING OF NATURE OBSERVATIONS DATABASE IN 2014
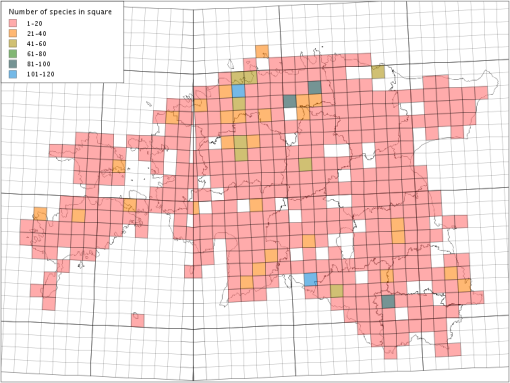
In 2014, users submitted 7301 observations to the Nature
Observations Database. It was the best year in the history of the database This map shows distribution of inserted observations
in 2014.
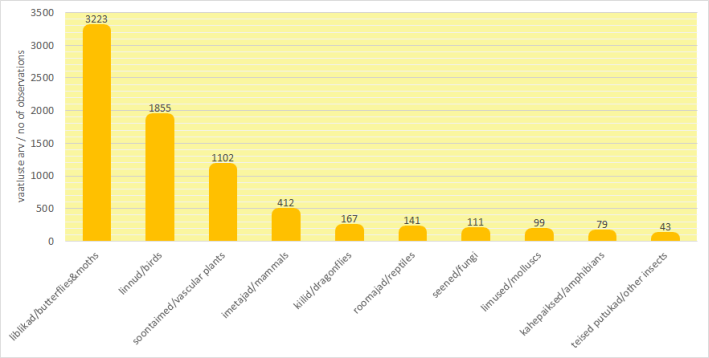
By groups of species inserted observations divided as
follow (here are only TOP 10 of species groups):
1) butterflies/moths - 3223 observations,
2) birds - 1855 observations,
3) vascular plants - 1102 observations,
4) mammals - 412 observations,
5) dragonflies - 167 observations,
6) reptiles - 141 observations;
7) fungi - 111 observations,
8) molluscs - 99 observations,
9) amphibians - 79 observations,
10) other insects (not include butterflies/moths and dragonflies) - 43 observations.
The most popular species which observations were entered were:
Ciconia ciconia 380 observations, Tetrao urogallus 106 observations, Bonasa bonasia 76 observations, Capreolus capreolus 75 observations, Grus grus 73, Orchis militaris 65 observations, Turdus viscivorus 60 observations and Tetrao tetrix 57 and Inachis io 56 observations. Summary observations of 1594 species were entered during the year.
Observations of species, which are under nature
conservation in Estonia, were entered 1848: 60 of these were observations of species under protection category I, 265 under protection category II and 1523 under protection category III.
159 persons entered their observations to the Nature
Observations Database in 2014. 97 of them inserted three or more
observations, 58 of them inserted more than 10 observations and 12 of them inserted more than 100 observations. Comparing with 2013 number of persons who entered observations to the database were increased.
By county: users entered more than 100 observations to
the Nature Observations Database from 14 counties. First was Harju (2328). Followed Pärnu (904), Saare (589), Põlva (582), Rapla (392) and Valga (362).

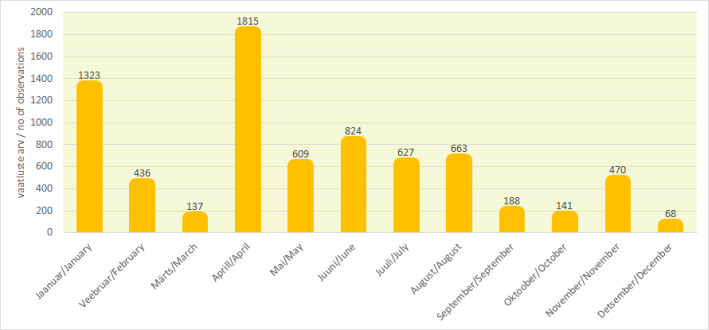
Observations submitted to the database were more frequent
in spring and in summer when observation campaige took place. The biggest numbers of inputs were in April (1815). Next were in January (1323), June (824), August (663), July (627) and May (609). During observation campaigne 716 observations were entered to the database. From April to August observations competition took place in Estonian Environment Agency. It brought 1754 observations to the database.